How did Single Family Homes change in value during 2025? Here are 10 charts that illustrate the 2025 San Francisco housing market.
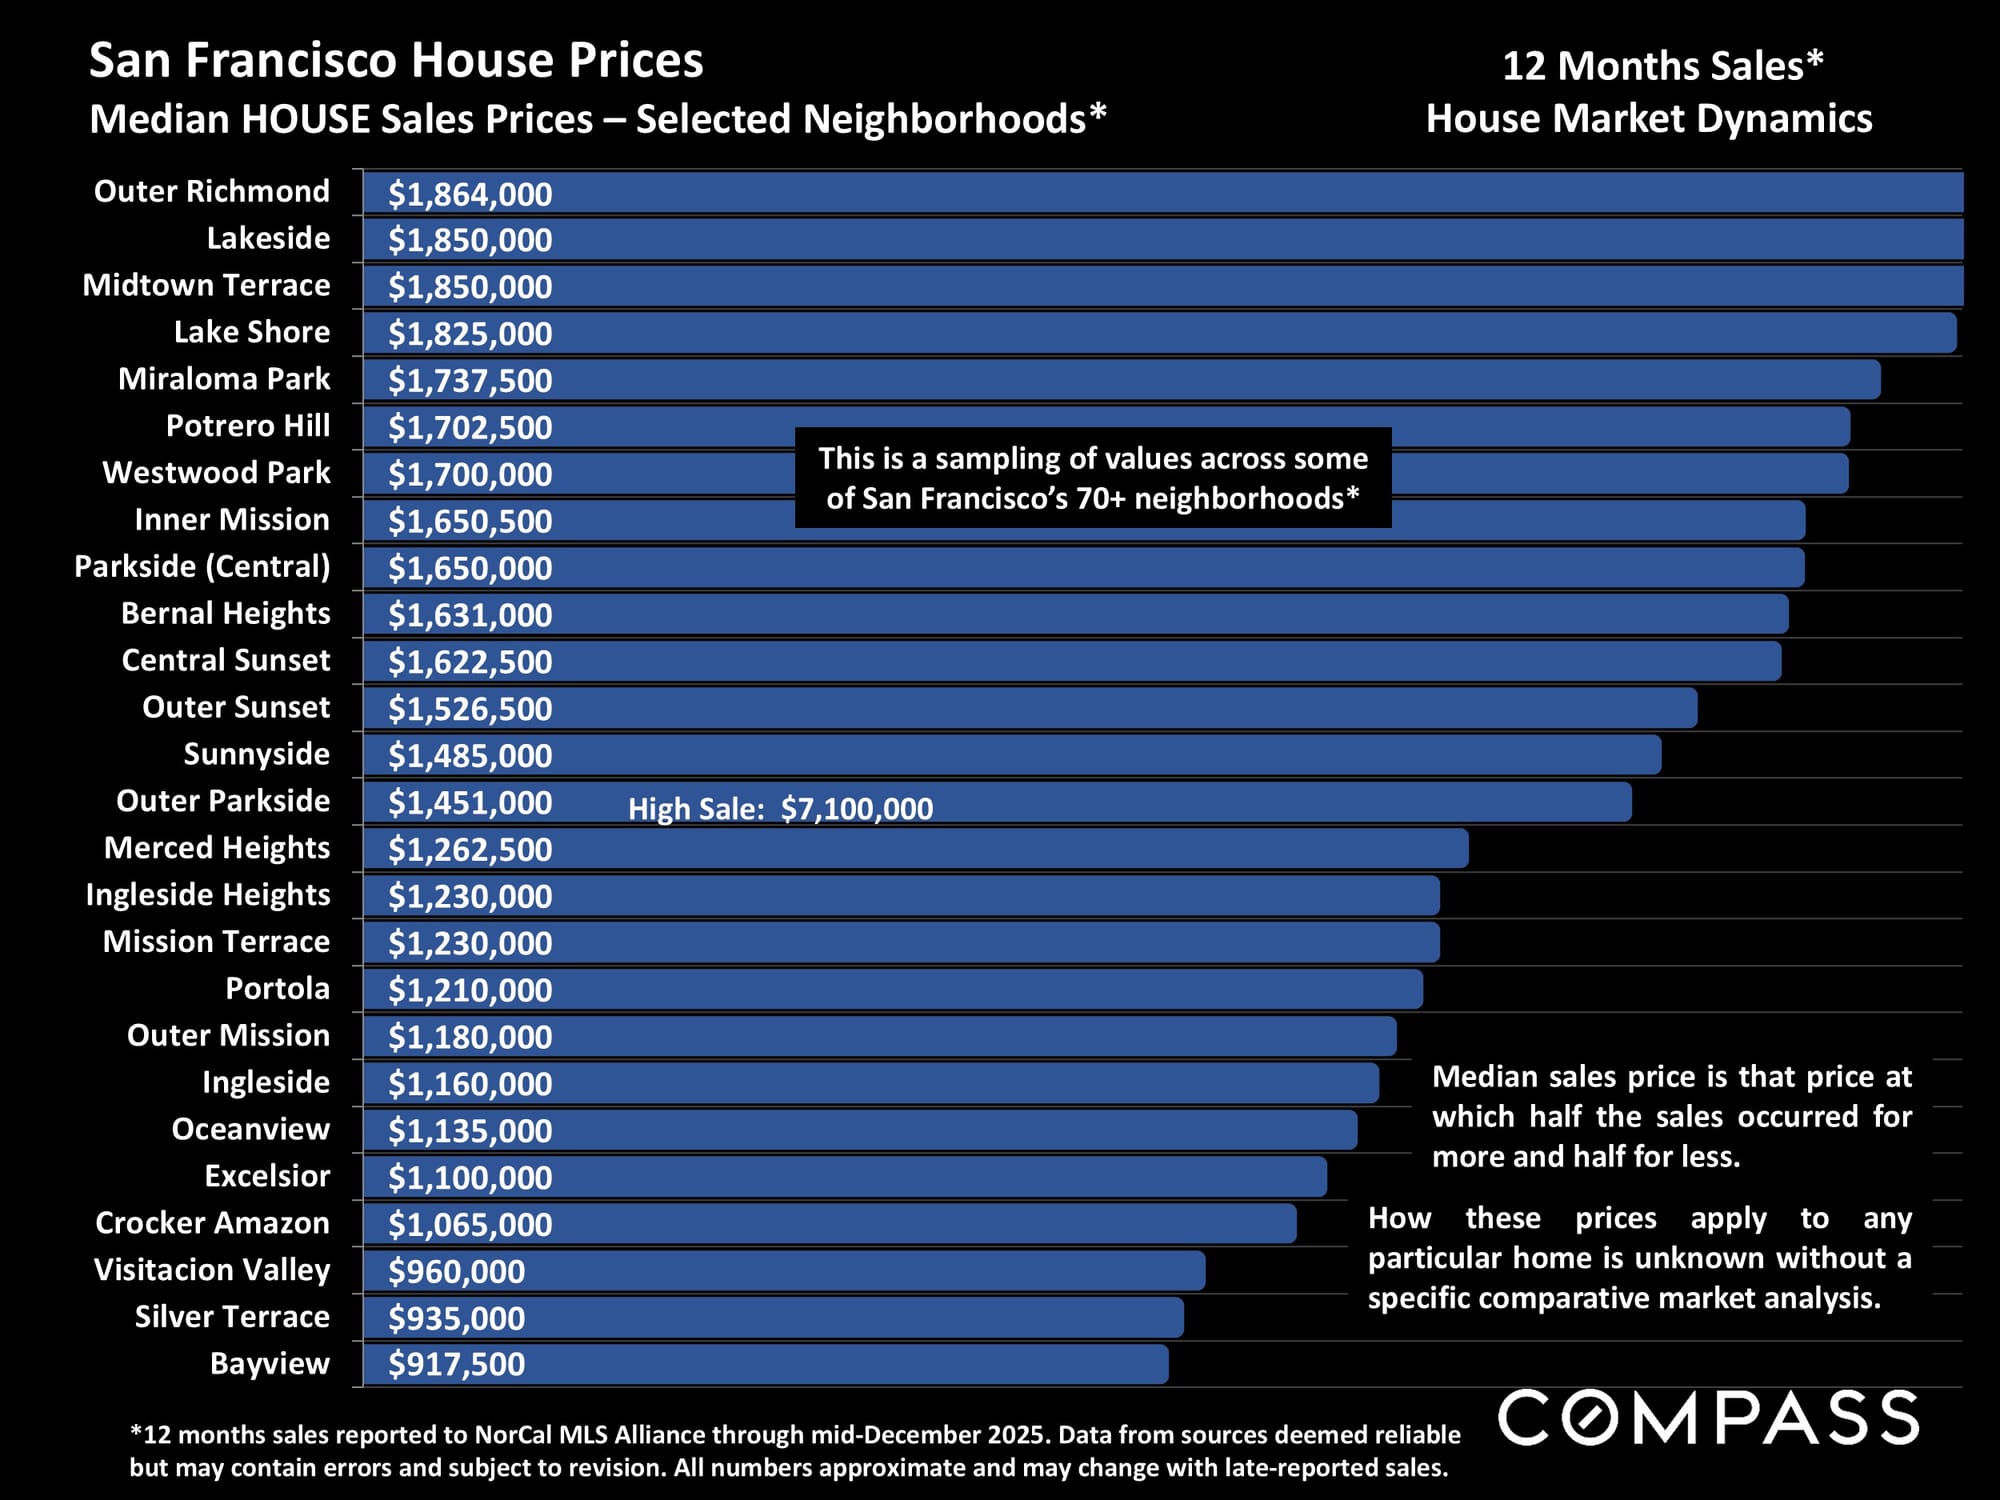
Median Single Family Home Prices in San Francisco by Neighborhood, Sorted from High to Low
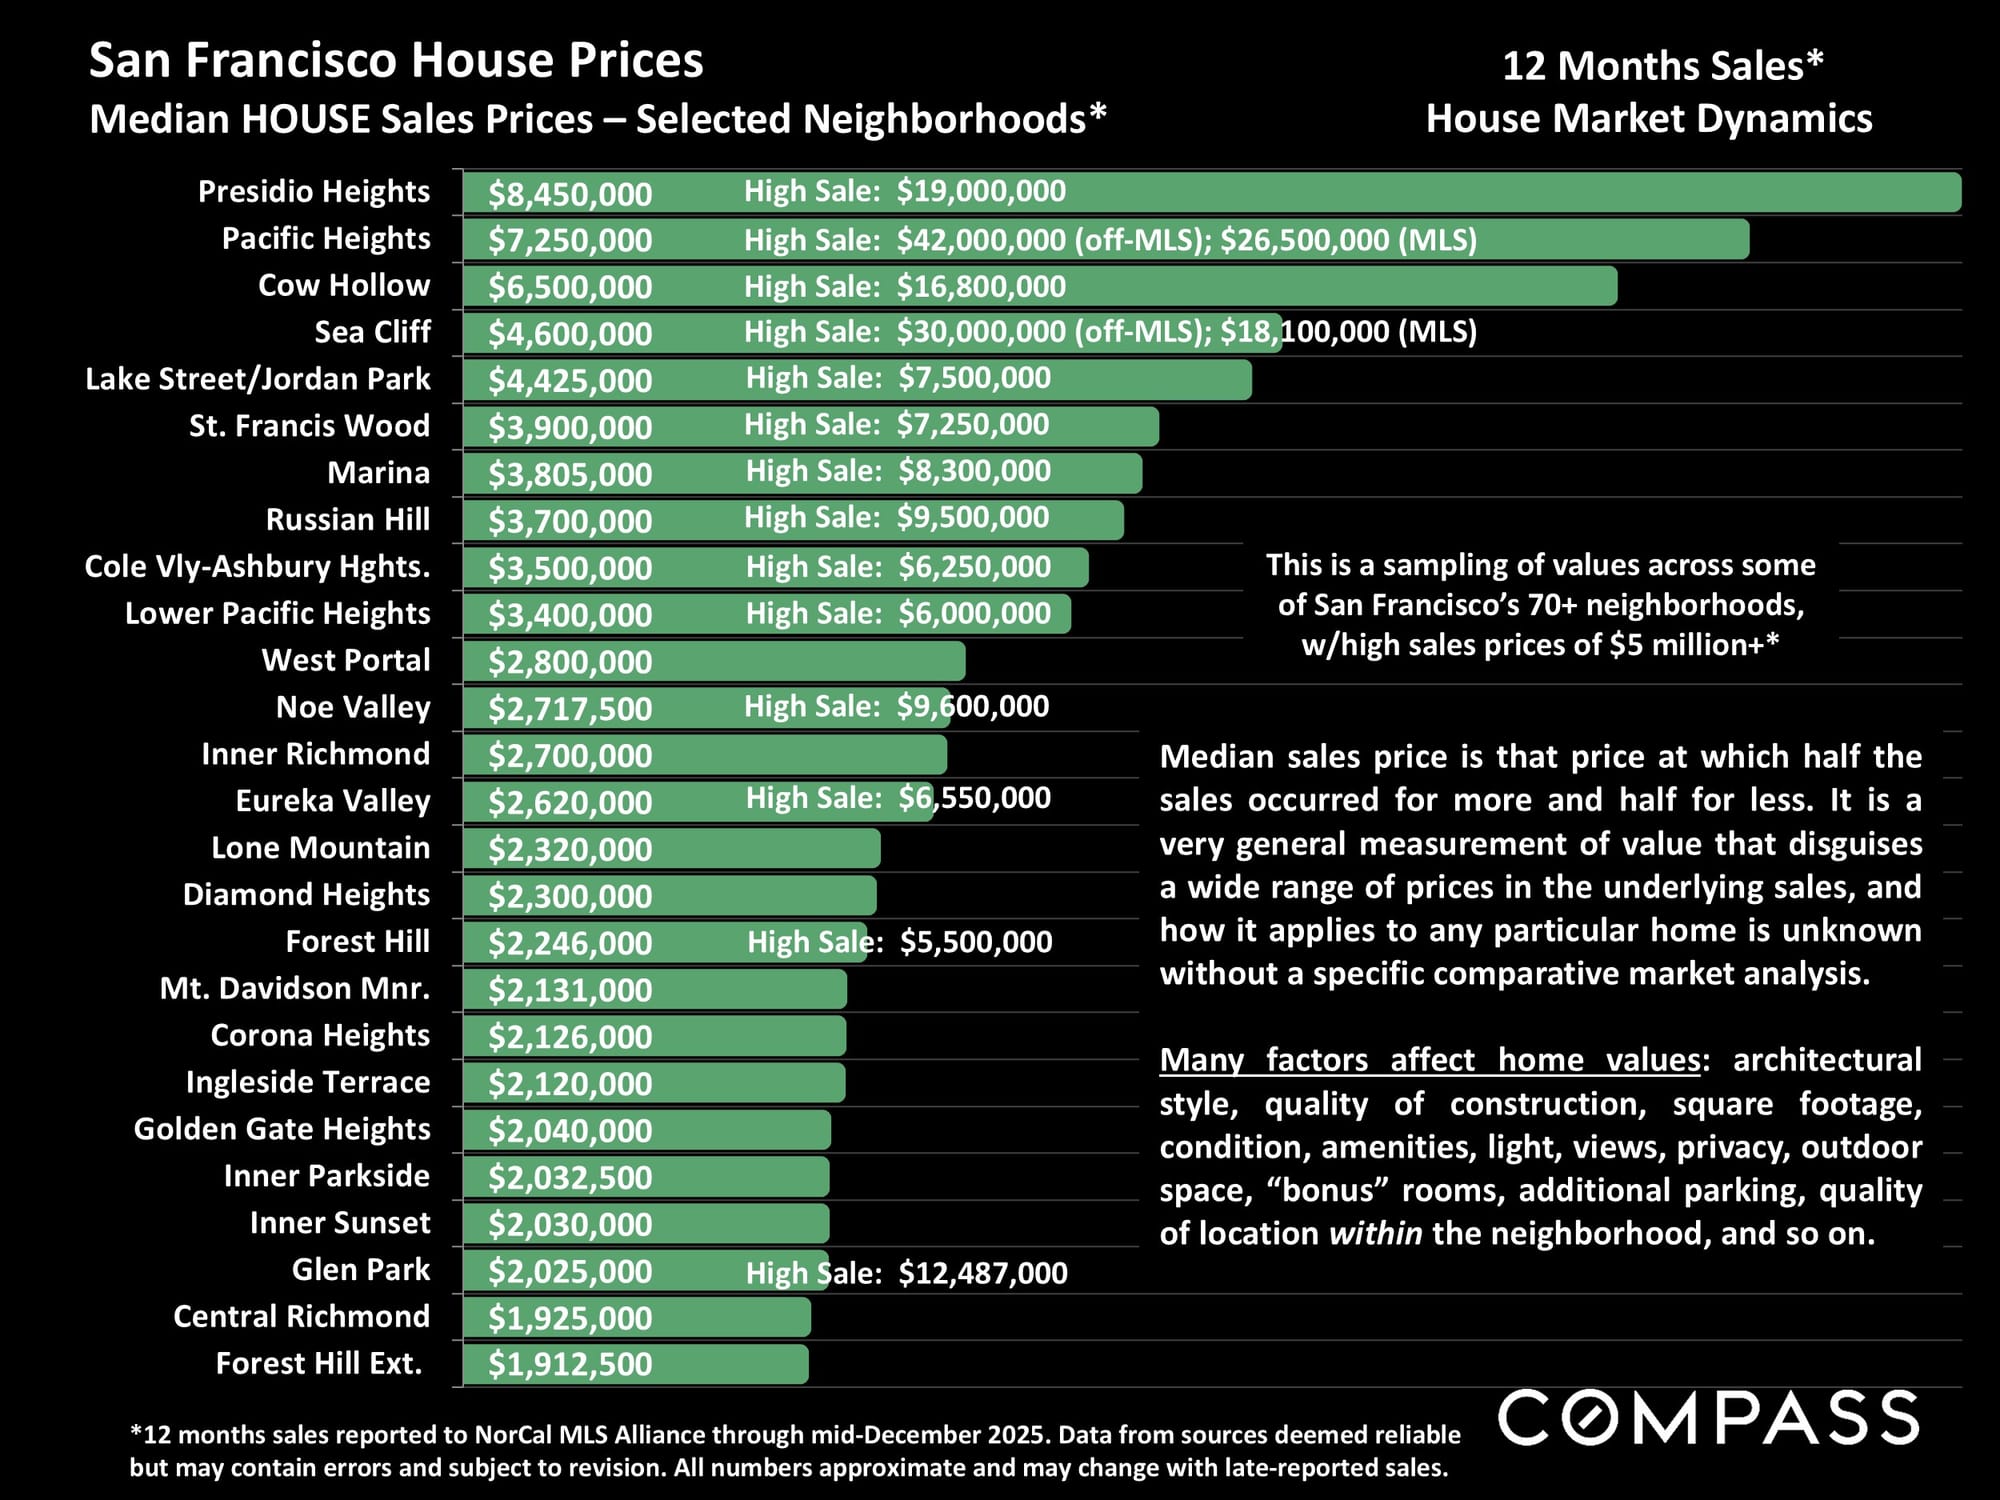
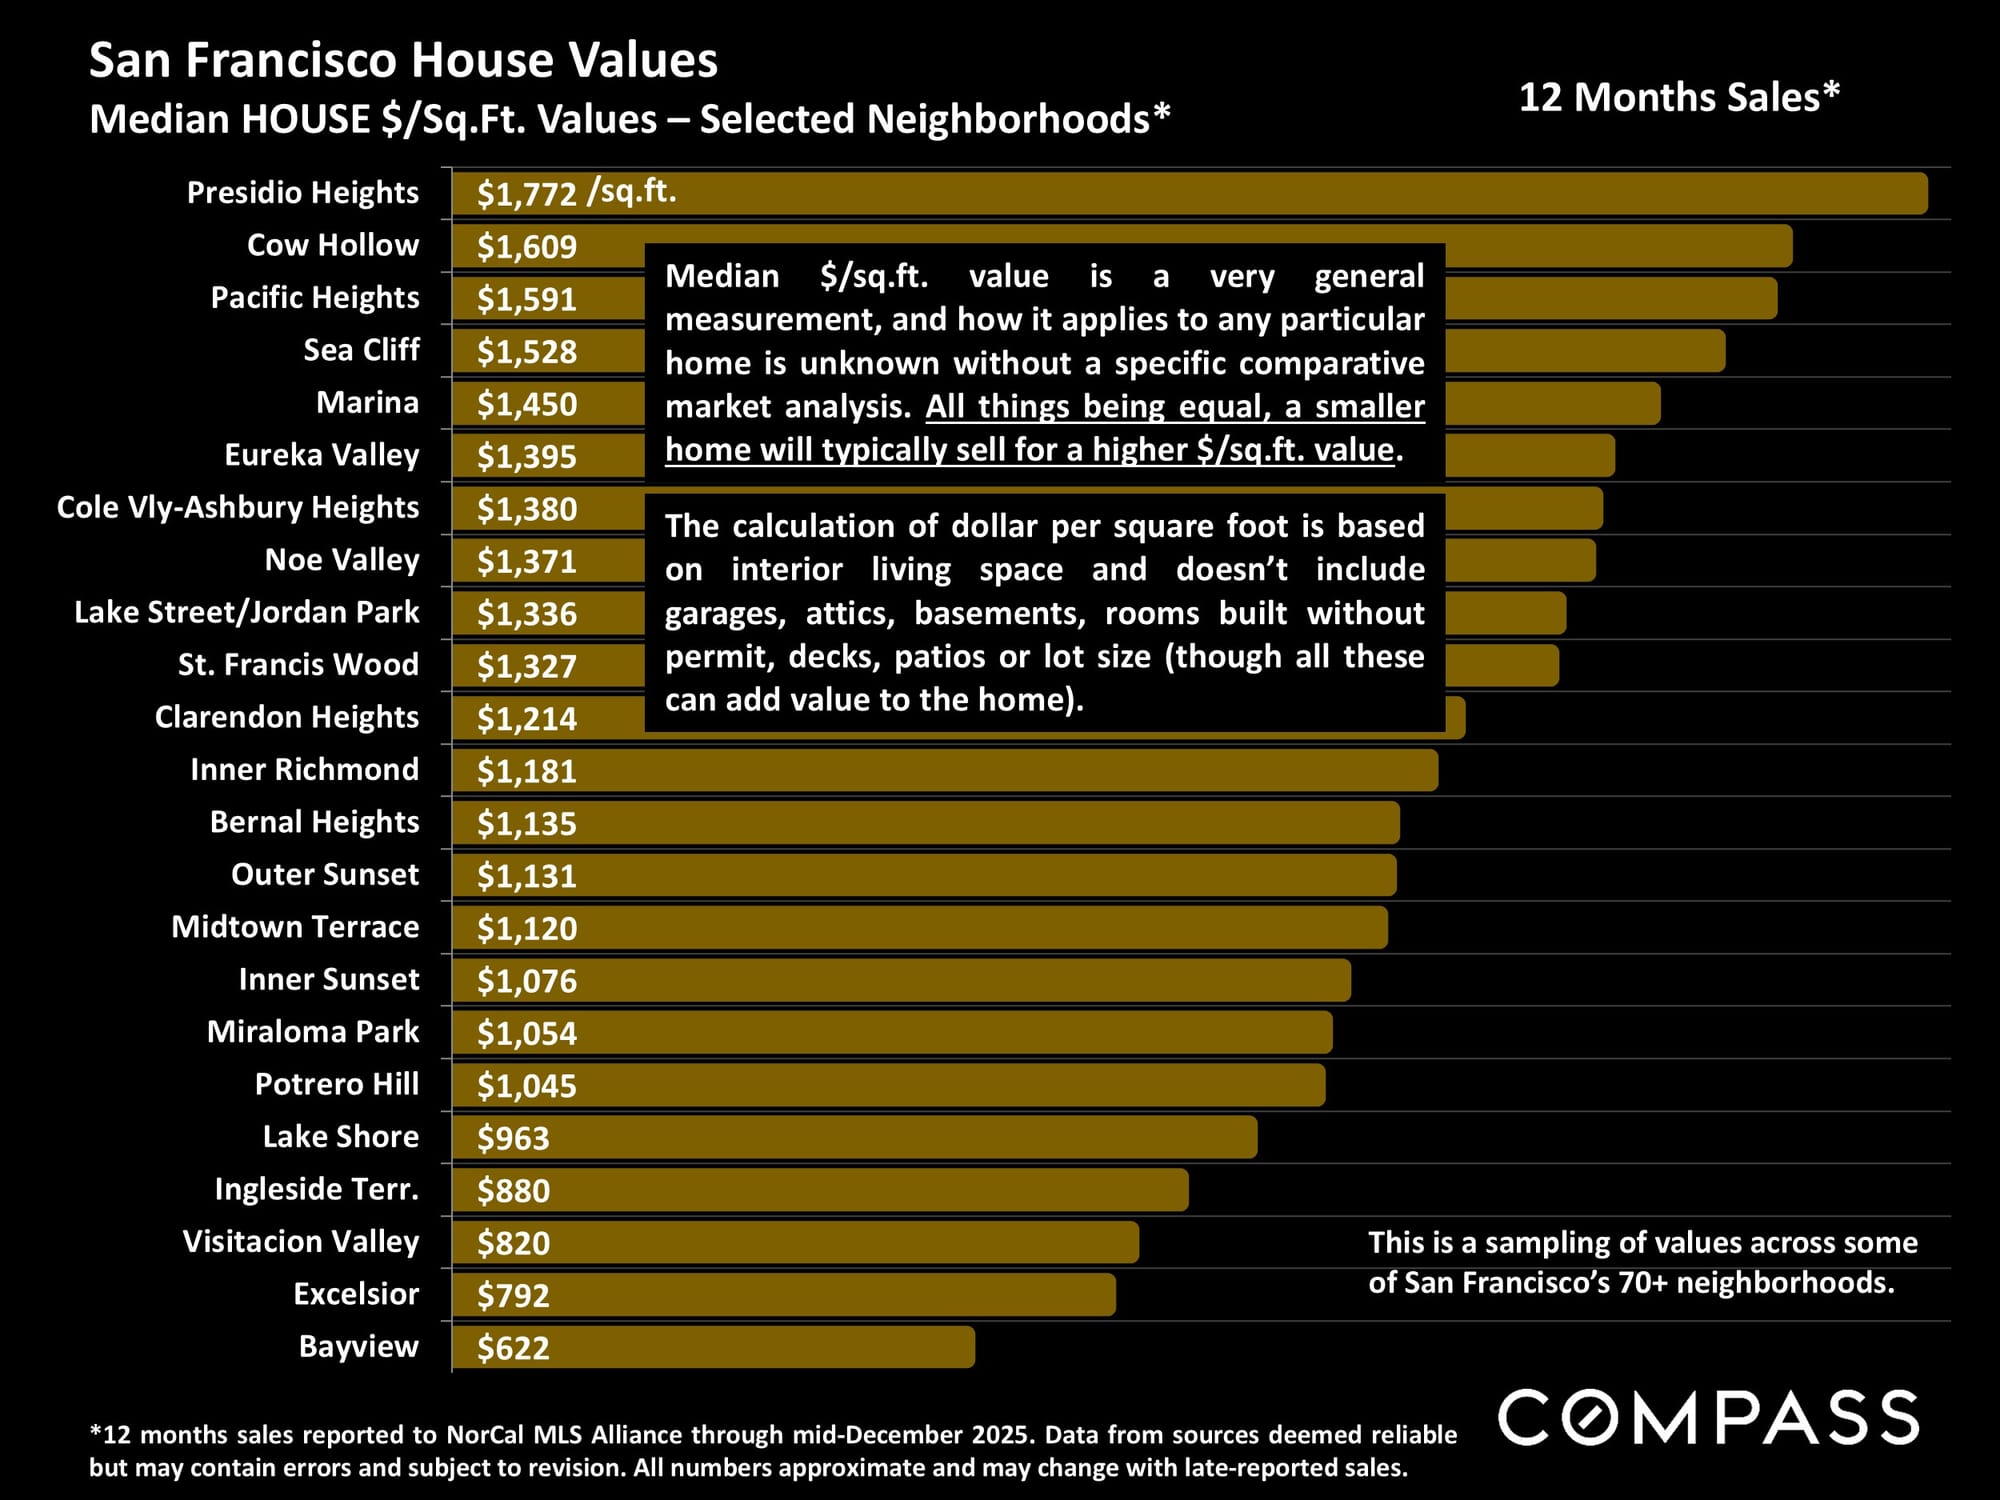
2025 Price per Square Foot for Single Family Homes in select San Francisco Neighborhoods
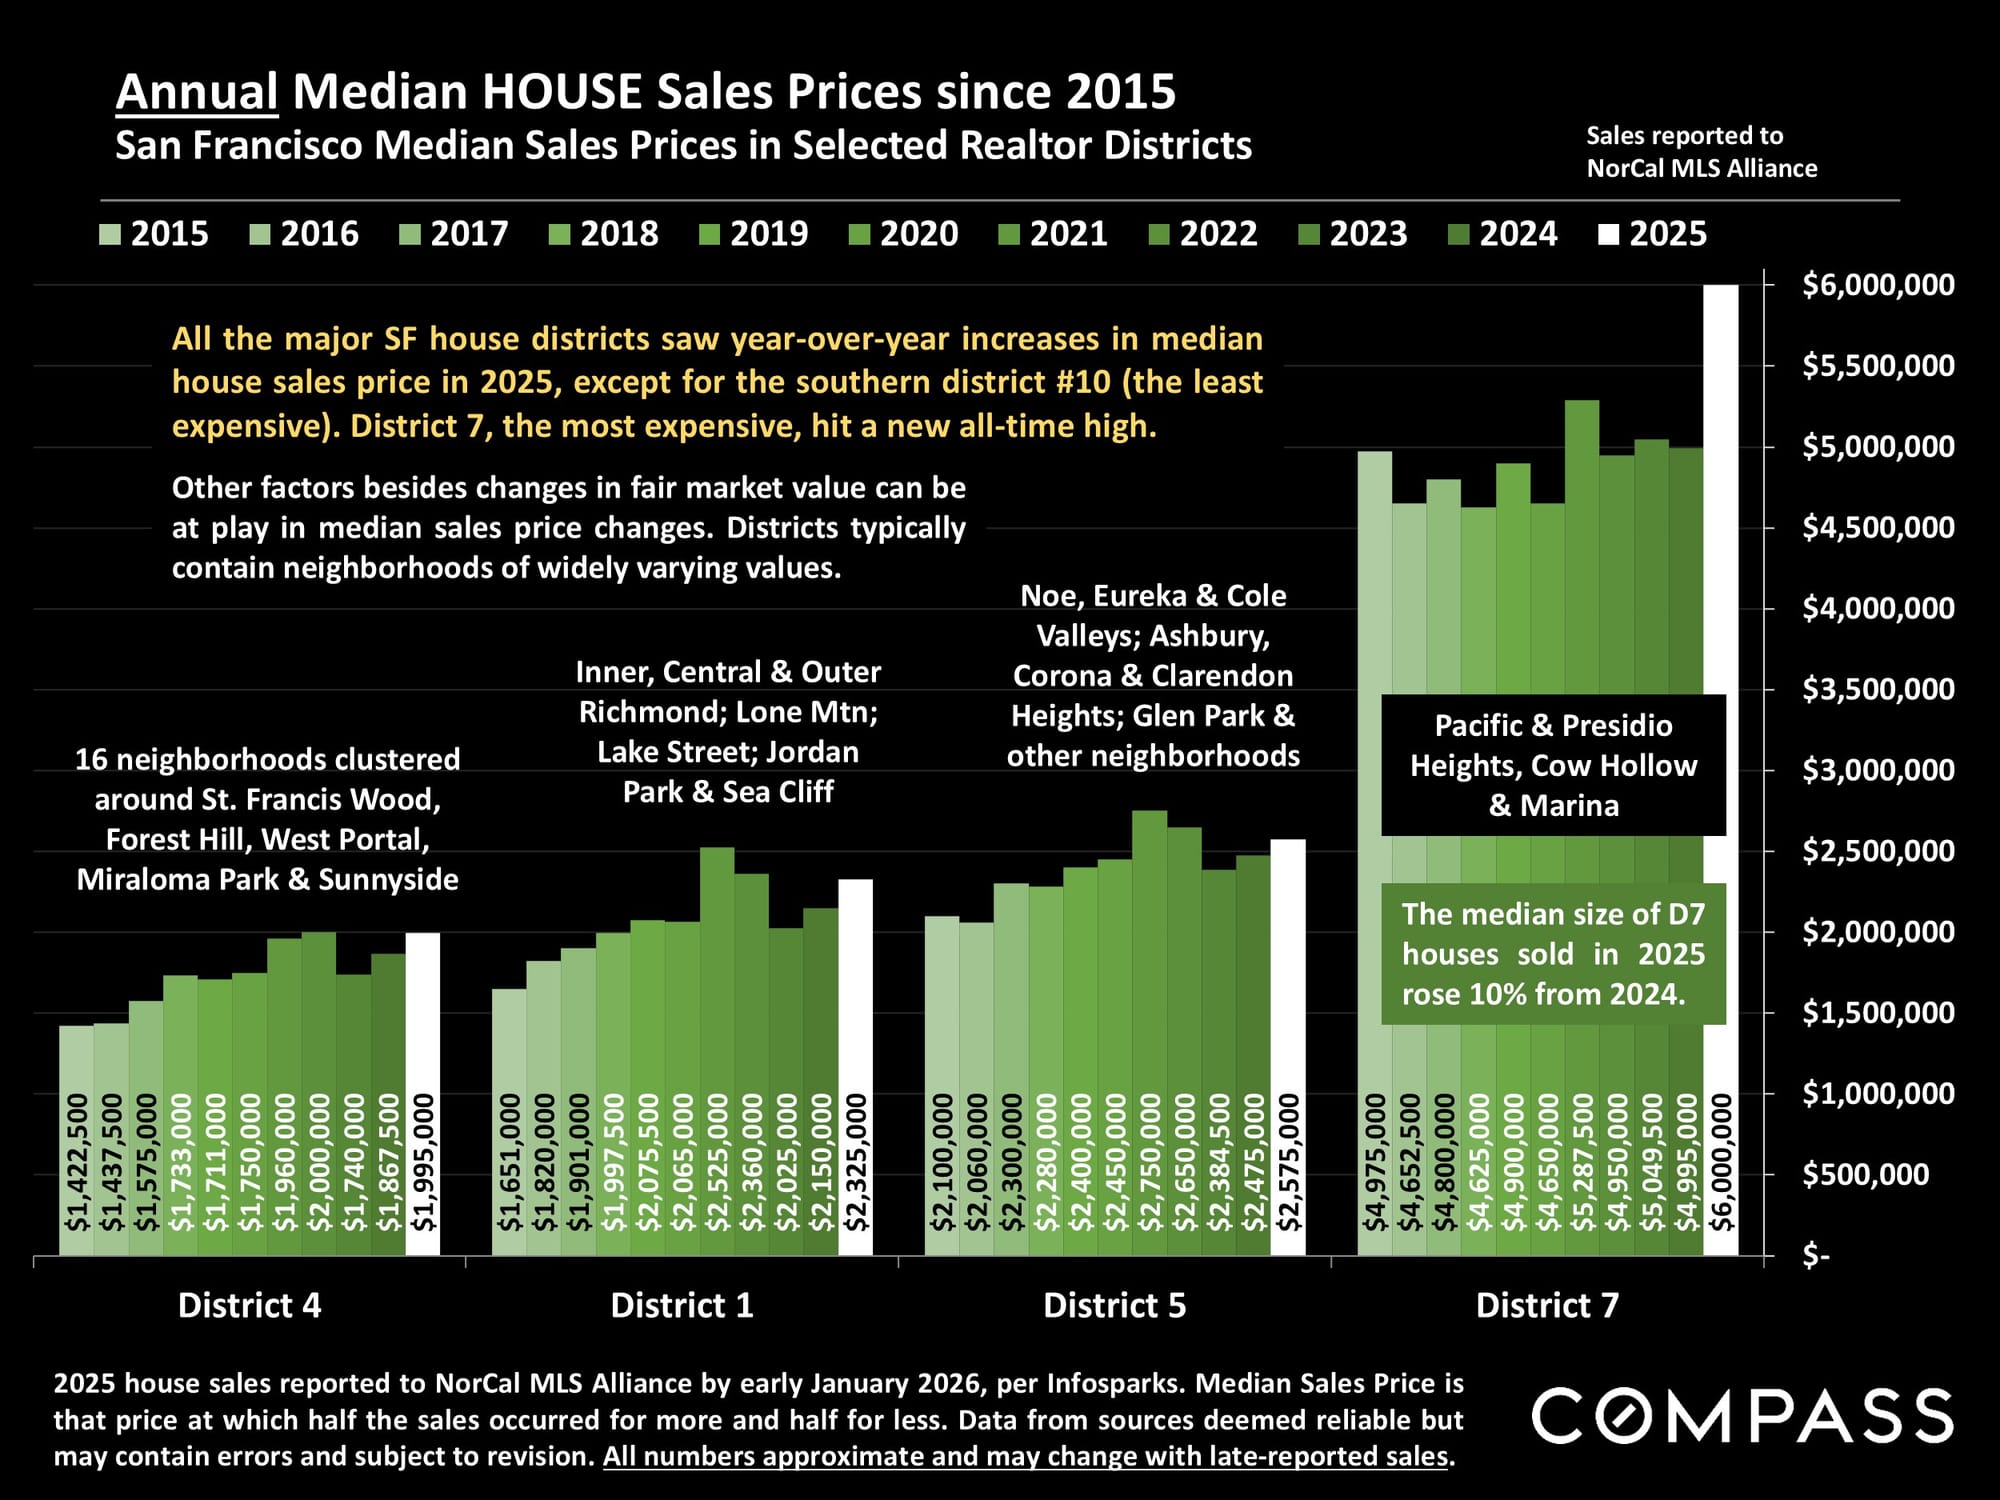
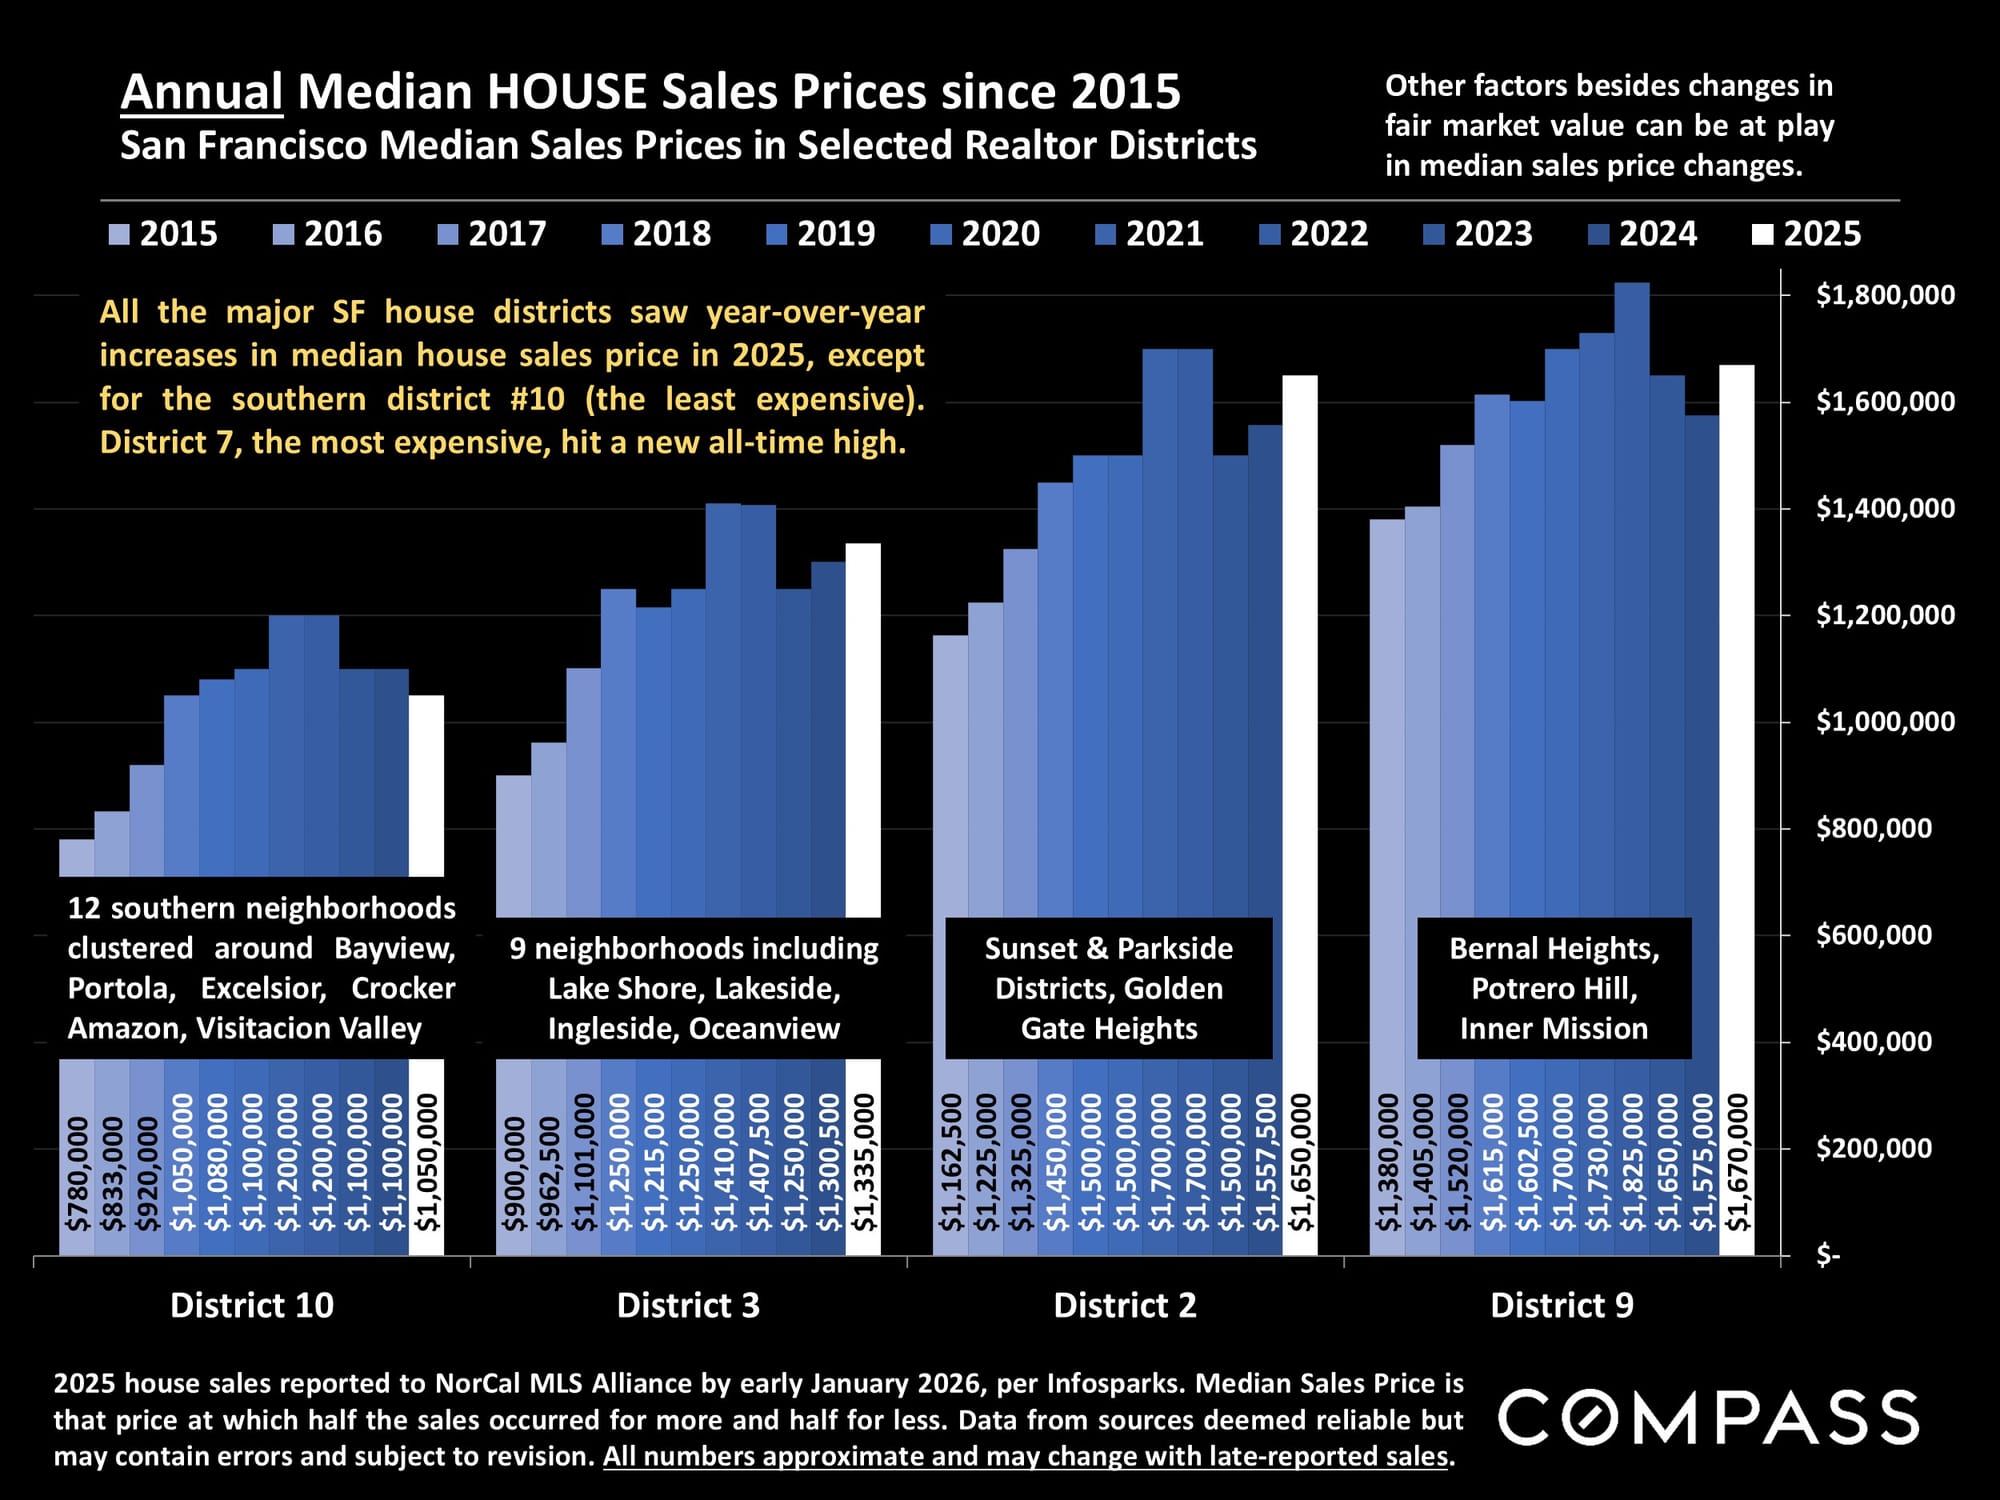
Annual San Francisco Single Family Home Appreciation by Neighborhood, 2015 - 2025
Lies, Damn Lies, and Real Estate Statistics
Disclaimers and additional thoughts about Median House Sales Prices & Annual Appreciation Calculations.
The 2025 SF district median house sales price calculations on the following annual-trend charts are based on calendar-year sales reported to NorCal MLS Alliance by early January 2026. They may change as late-reported sales are entered into MLS: A few additional home sales may alter the median sales price, especially in smaller markets.
Median home sales prices are not like stock prices where each share sold is essentially the same product period to period: Median home prices are calculated using differing collections of unique home sales occurring in each period measured.
There is no such thing as an unchanging "median house" whose change in value can be determined at different times. The median size of houses sold can sometimes vary significantly period to period, or within a city, sales in one district neighborhood increase while declining in another. Sales in different price segments can be affected differently by economic circumstances such as interest rates or stock markets. All these situations can impact median sales prices in ways unrelated to fair market value.
Changes in median sales prices are not exact measurements of area appreciation or depreciation, but using large datasets, they typically generate fairly reliable indicators of general trends in fair market values. (Expensive markets with relatively small sales volumes occurring over wide ranges of sales prices are most prone to anomalous fluctuations in median prices.)
How median sales prices and appreciation calculations apply to any particular home is unknown without a specific comparative market analysis.
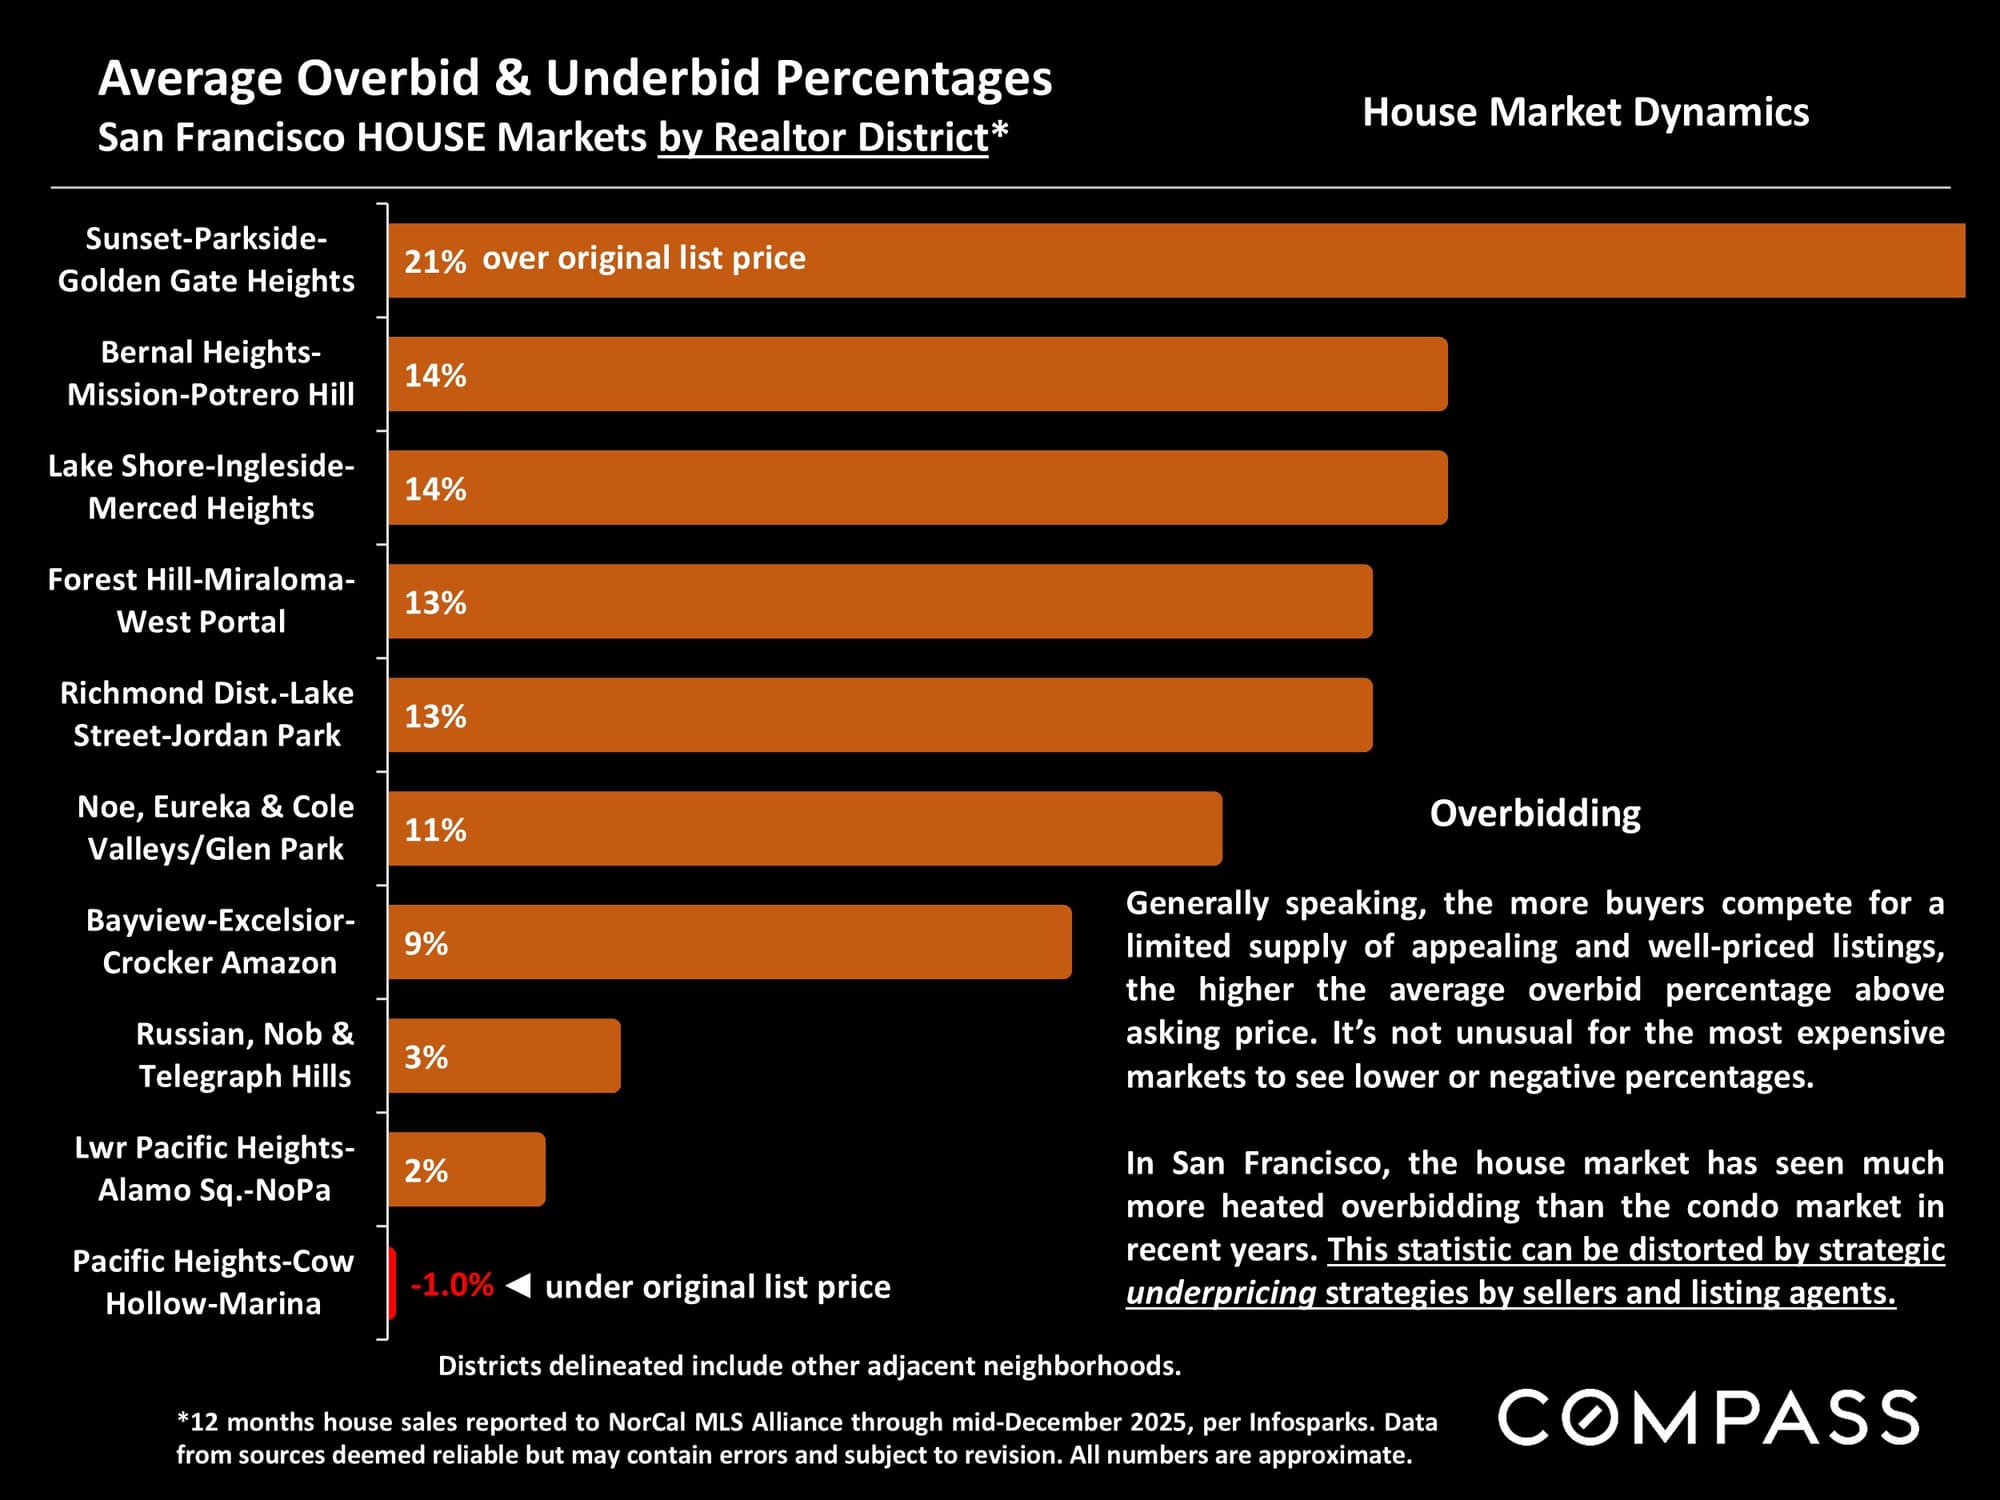
Average Overbid & Underbid Percentages for Single Family Homes in San Francisco, 2025
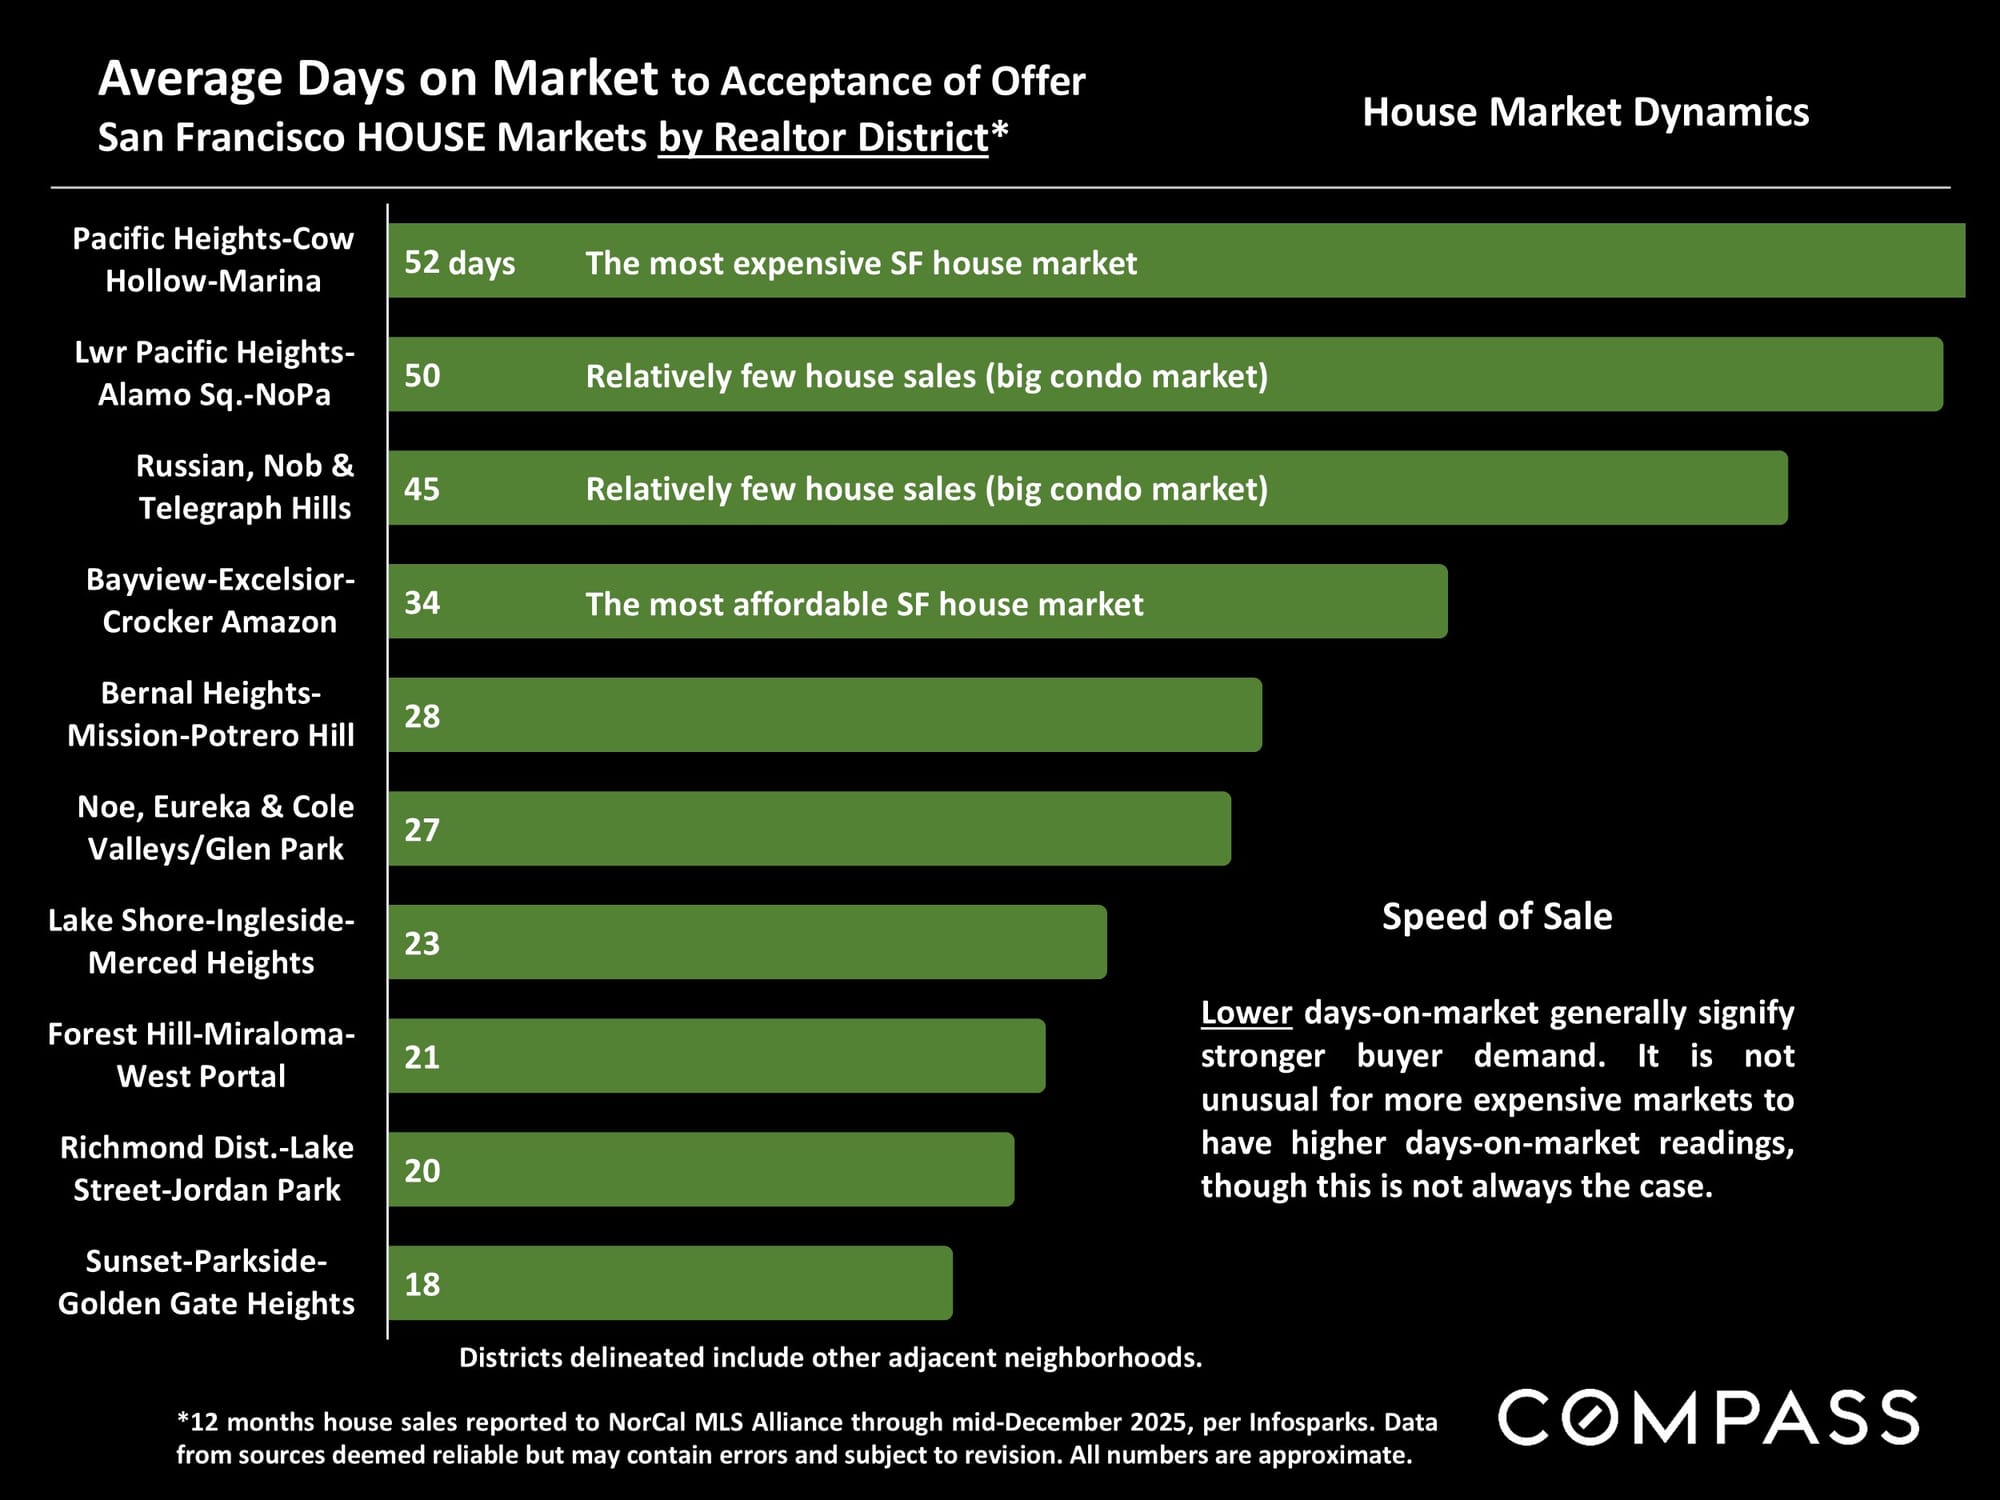
Average Days on Market (DOM) for Single Family Homes in San Francisco, 2025 by Neighborhoods
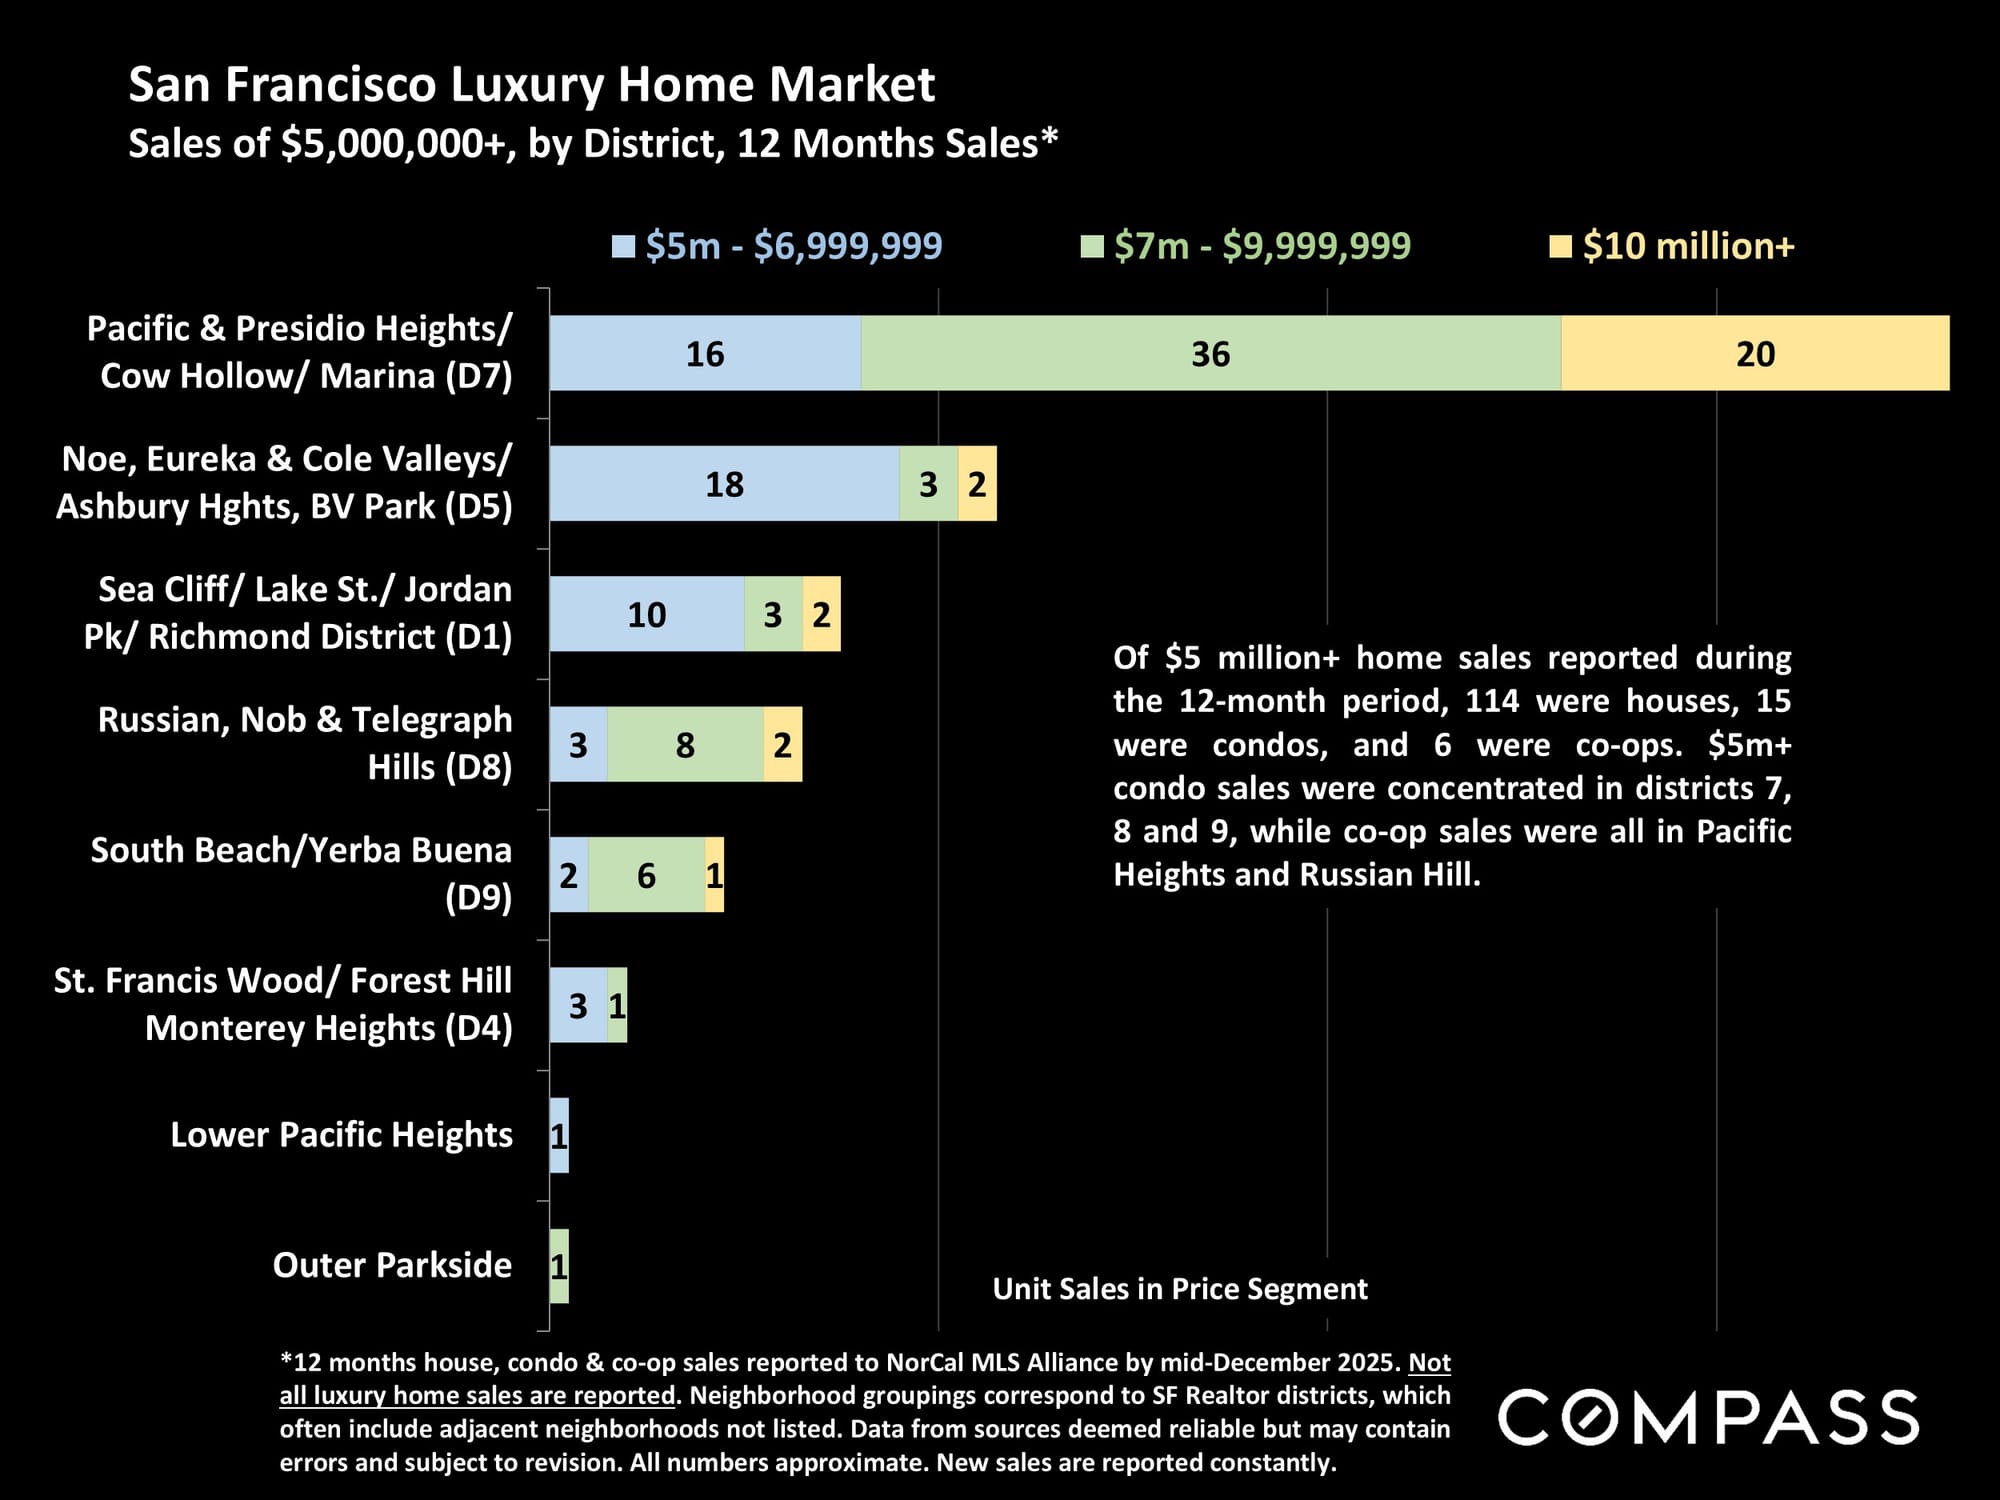
San Francisco Luxury Home Market, 2025
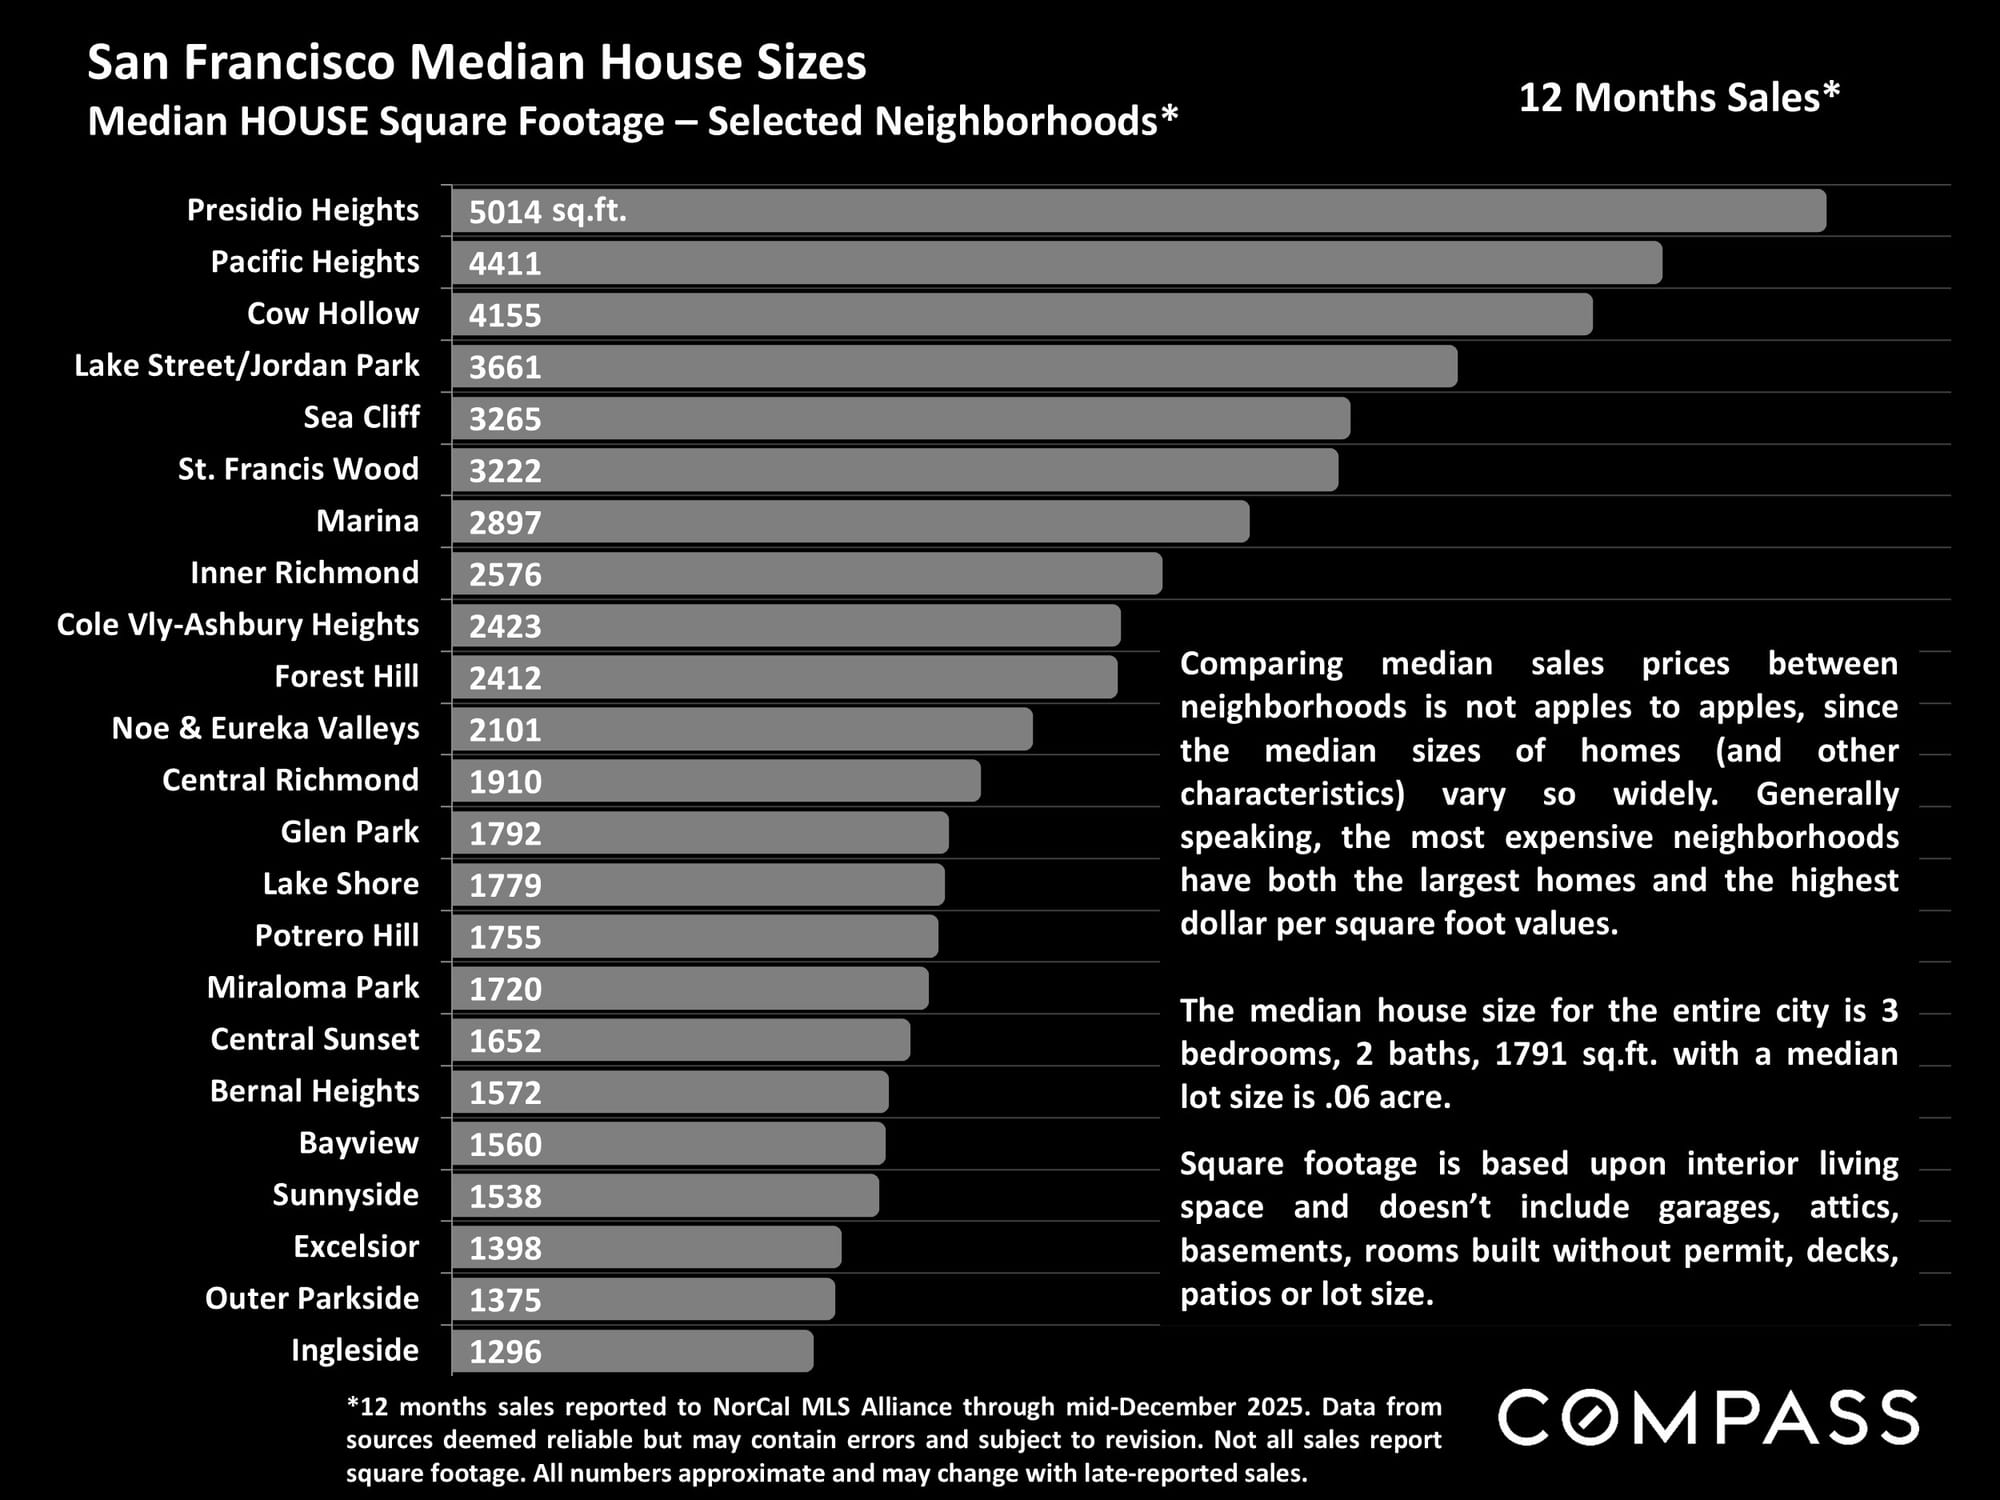
San Francisco Median Single Family Home Size, 2025
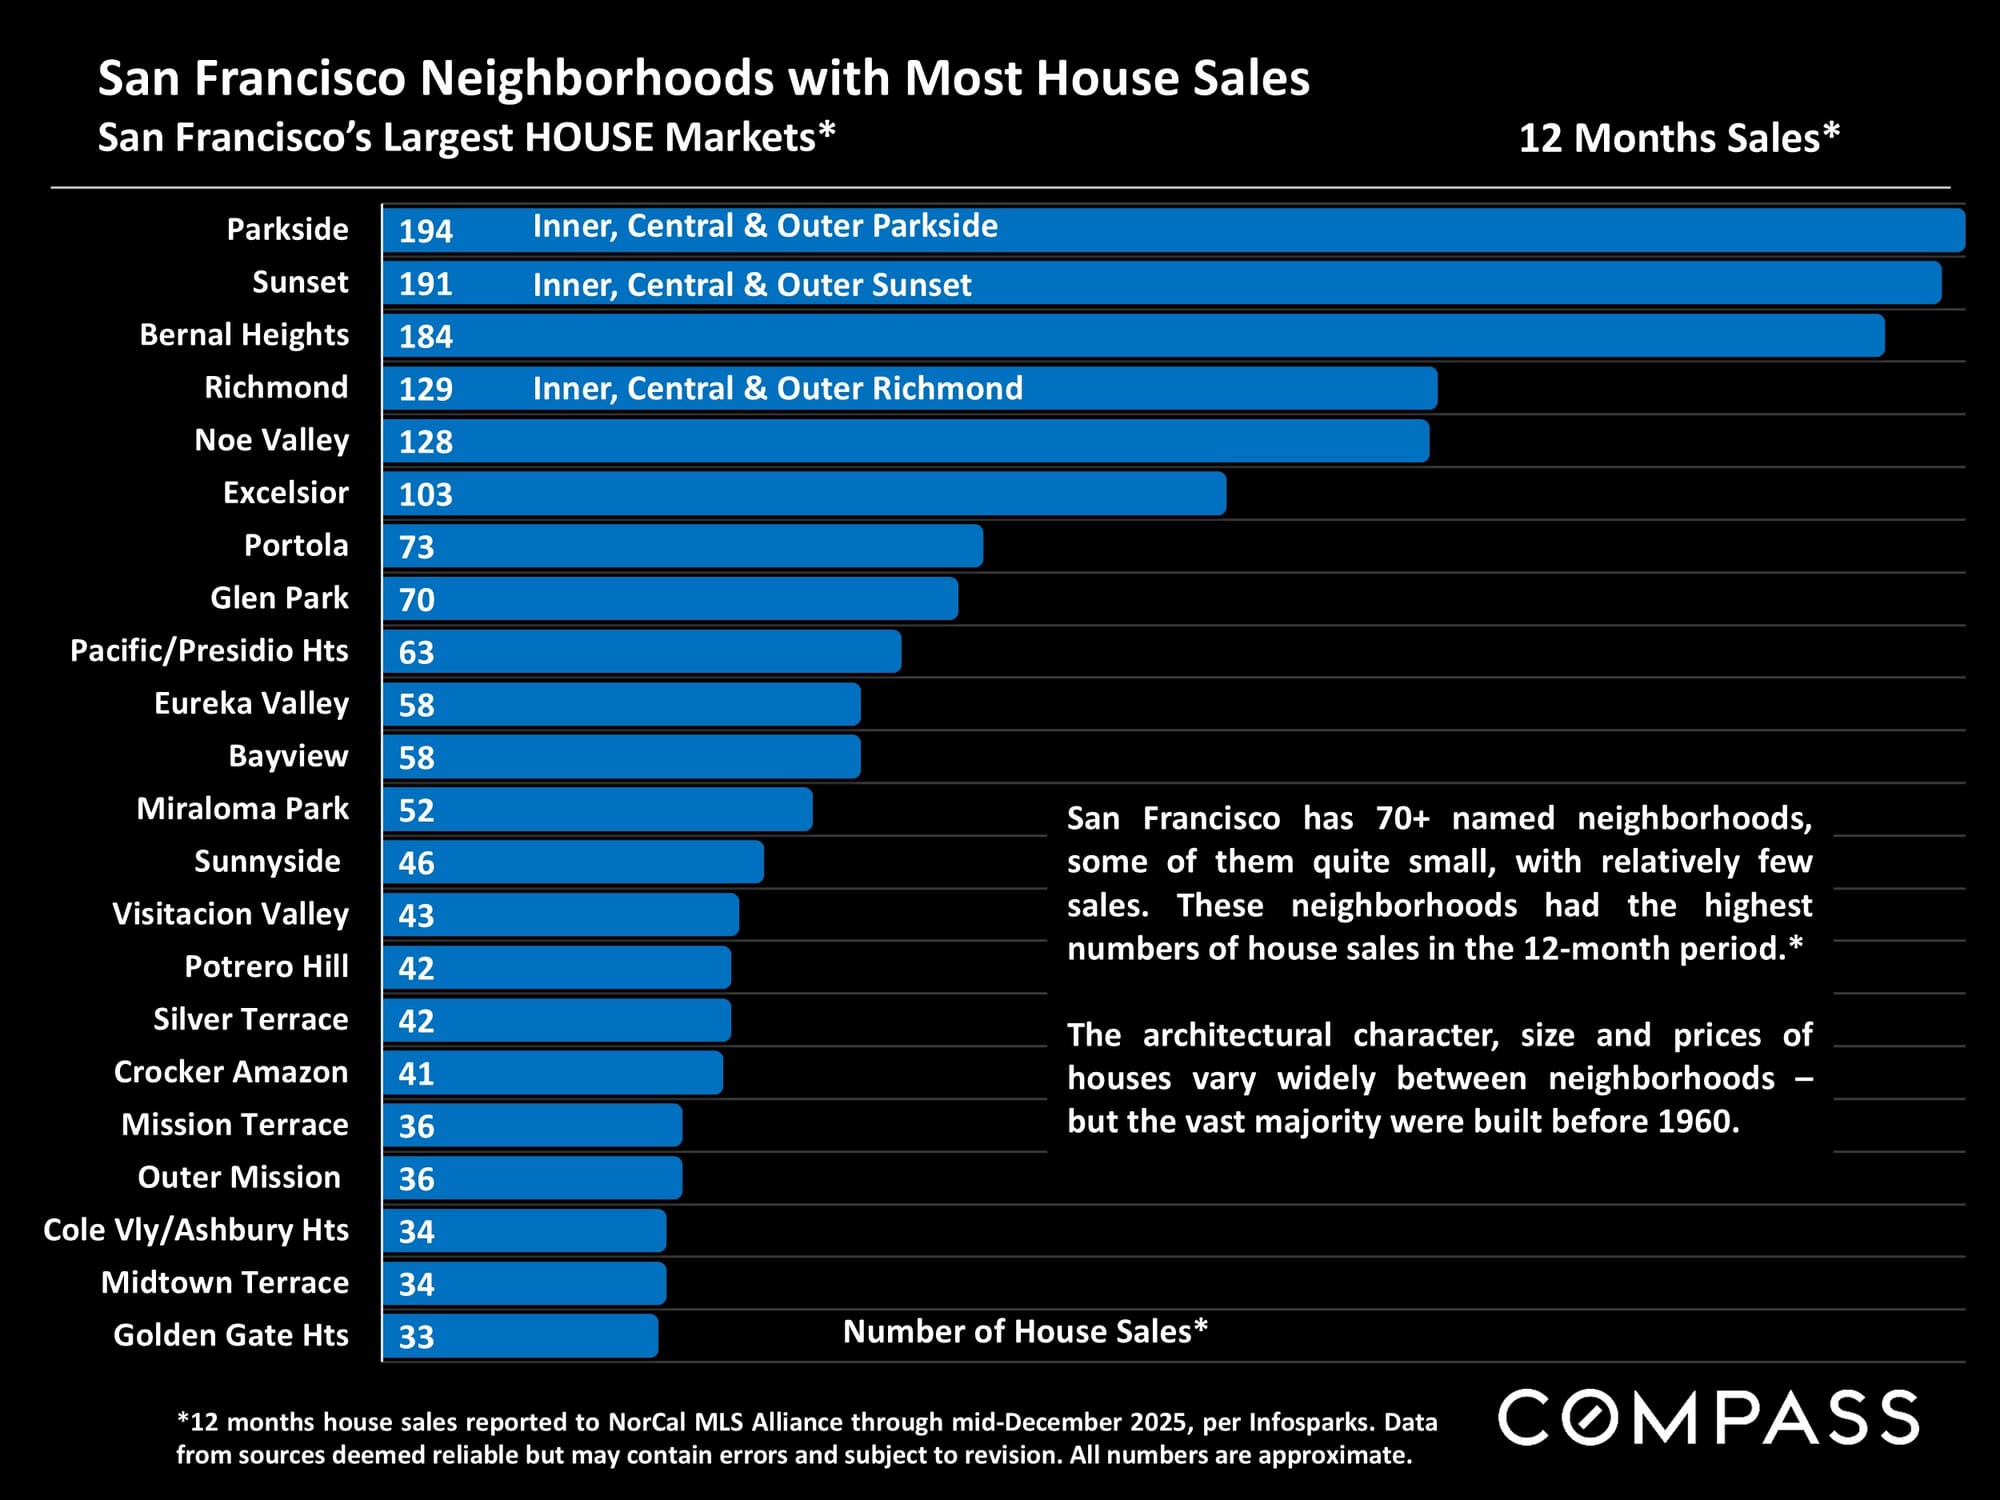
Number of Single Family Home Sales by Neighborhood, 2025
Ready to learn more about a specific neighborhood or property? Reach out to The Fuller Team today and let's start a conversation to see if working together is a good fit.
A Note About Our Charts
12 Months Sales through mid-December 2025: 12-month data removes seasonality from calculations but may lag short term developments.
Realtor districts can contain neighborhoods of widely varying demographics and characteristics, housing types and values: The numbers in this report are generalities, and how they apply to any particular property is unknown without a specific comparative market analysis. Statistics are generalities and anomalous fluctuations in statistics are not uncommon, especially in smaller district and neighborhood markets with fewer sales and wide ranges in sales prices. The time period for each analysis is delineated at the bottom of the chart. Data is believed to be accurate and is not warranted.
Guide to San Francisco Neighborhoods by the SF Realtor Association